Plot
Plot from server
local $ ssh -X rocky
rocky $ tmux ... # open a tmux session if you like
rocky $ julia # call julia, then plot as usual
julia> using Plots
julia> plot(1:10)
Without -X option, it will throws
qt.qpa.xcb: could not connect to display
qt.qpa.plugin: Could not load the Qt platform plugin "xcb" in "" even though it was found.
This application failed to start because no Qt platform plugin could be initialized. Reinstalling the application may fix this problem.

Available platform plugins are: linuxfb, minimal, offscreen, vnc, xcb.

connect: Connection refused
GKS: can't connect to GKS socket application


signal (11): Segmentation fault
in expression starting at none:0
By the way, the same error was also thrown when just plot into a file instead of popping up, a magic trick can be tried,
# https://discourse.julialang.org/t/generation-of-documentation-fails-qt-qpa-xcb-could-not-connect-to-display/60988/4
ENV["GKSwstype"] = "100"
Math formula
- only formula:
L"\alpha" - consists of plain text and formula:
latexstring("Growth Curve (\$\\sigma = 1.5\$)")
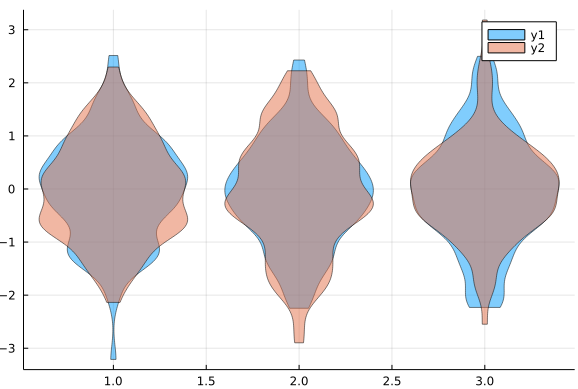
Violin Plot
using StatsPlots
violin(repeat([1,2,3],outer=100),randn(300), alpha = 0.5)
violin!(repeat([1,2,3],outer=100),randn(300), alpha = 0.5)
applications: proj_offset
等高线图 (contour)
using Plots
using Distributions

x_grid = range(-2, 2, length=100)
y_grid = range(-2, 2, length=100)
Sigma = [1 0.9; 0.9 1];
contour(x_grid, y_grid, (x, y)->pdf(MvNormal([0, 0], Sigma), [x, y]), cbar=false)
网格 3D 图
要求颜色随着高度渐变,这包含两部分的渐变,
- 不同纬度上的每一个截面圆指定颜色
- 经线的的不同维度需要分段指定颜色
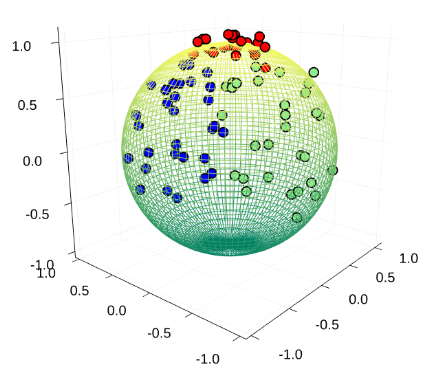
第一点其实很简单,当生成好一组渐变颜色后,比如
colors = cgrad(:summer, nz, categorical = true)
更多的选择详见 Colorschemes
在循环画图时,每次指定一种颜色便 OK 了。
第二点其实也很简单,在画一条曲线时,如果 linecolor 指定为颜色列向量,比如 [:red, :green, :orange],则每一段的颜色会循环采用该列向量中的颜色,则当列向量长度刚好等于区间段的个数,则每一段都会以不同的颜色绘制。需要注意到是,颜色行向量用于画多条曲线时为每一条曲线指定不同的颜色。
但最后第二点折腾了有点久,直接把 colors 带进去并不行,后来才发现它不是简单的颜色列向量,里面还包含其它信息,最后采用 colors.colors.colors 才成功。详见 ESL-CN/code/SOM/wiremesh.jl
另外,也尝试过官方文档例子中 zcolor 参数,但是似乎只针对 marker 起作用,当然是跟 m = 参数配合的效果,第一个元素代表大小,第二个透明度。所以理论上把 m = 换成 line 或许也能达到效果,但如果不能直接通过 zcolor 使得不同高度的颜色不一样(我本以为可以),那干脆直接指定颜色。
axis off
plot(..., axis = nothing)
and similar grammar is
plot(..., ticks=nothing, border=nothing)
refer to How can I implement “axis off”? #428
In practice, I adopted axis = nothing, border = :none.
plot kernel density
refer to Kernel density estimation status
PyPlot
- grid_plot_acc_vs_rate_revisit and demo
- multiple subplots with
sharex="all", sharey="all" ax0 = fig.add_subplot(111, frameon=false)plt.text
- multiple subplots with
Multiple labels
In Julia 1.4.0 with Plots.jl v1.0.14,
using Plots
x = rand(10, 2)
plot(1:10, x, label = ["a", "b"])
will produce
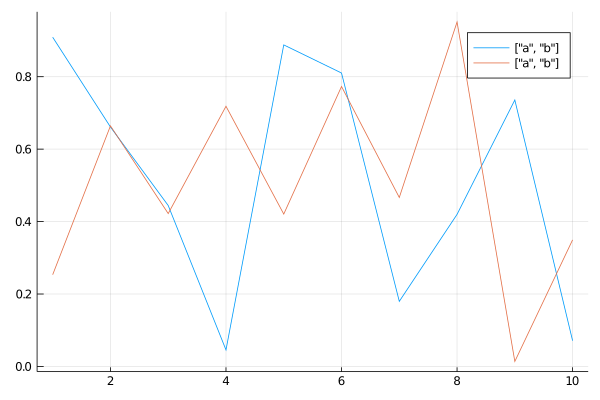
where these two lines share the same label instead of one label for one line.
But if replacing the column vector with row vector,
plot(1:10, x, label = ["a" "b"])
will return the correct result,
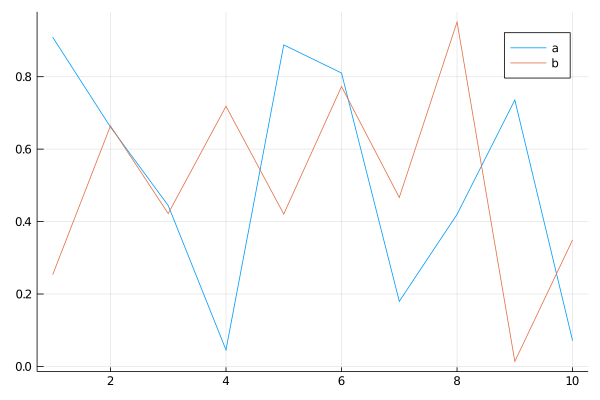
Refer to Plots (plotly) multiple series or line labels in legend, which also works GR backend.
suptitle for subplots
currently, no a option to set a suptitle for subplots, but we can use @layout to plot the title in a grid, such as szcf-weiya/TB
refer to Super title in Plots and subplots
PGFPlotsX
Tips:
ERROR: MethodError: no method matching _show(::IOStream, ::MIME{Symbol("application/pdf")}, ::Plots.Plot{Plots.PGFPlotsXBackend})
-
rebuild
GRifERROR: could not load library "libGR.so". Possible reason is that the version (such asBwGt2) to use has not been correctly built, although it was working well in other versions, such asyMV3y.
when using layout with setting like @layout([a{0.05w} b; _ c{0.05h}])
! Package pgfplots Error: Error: Plot width `15.99043pt' is too small. This can
not be implemented while maintaining constant size for labels. Sorry, label sizes
are only approximate. You will need to adjust your width..
set a larger size, say, increasing 0.05 to 0.2.
GR: Too many open files
The complete error message is
No XVisualInfo for format QSurfaceFormat(version 2.0, options QFlags<QSurfaceFormat::FormatOption>(), depthBufferSize -1, redBufferSize 1, greenBufferSize 1, blueBufferSize 1, alphaBufferSize -1, stencilBufferSize -1, samples -1, swapBehavior QSurfaceFormat::SwapBehavior(SingleBuffer), swapInterval 1, profile  QSurfaceFormat::OpenGLContextProfile(NoProfile))
Falling back to using screens root_visual.
socket: Too many open files
GKS: can't connect to GKS socket application
see the private repo for more details. The issue has been discussed in GKS file open error: Too many open files #1723, the solution is
GR.inline("png")
I also came across similar issue with matplotlib.pyplot, but it just throws a warning, and one solution is to set
plt.rcParams.update({'figure.max_open_warning': 0})
refer to warning about too many open figures
Legend
legendtitle- as a subplot:
plot(p1, p2, p3, p4, plegend, layout = @layout([a b [c{0.6h}; [d e{0.3w}]] ]))- example in the Cell-Video project
- shared legend for two subplots: example in the Clouds project
- horizontal legend: currently (2022-06-14 17:37:45) only for PGFPlotsX backend
- feature request for other backend, which includes my comment for usage with PGFPlotsX

- an example, motivated by
- feature request for other backend, which includes my comment for usage with PGFPlotsX
- left alignment in PGFPlotsX backend: by default, it aligned to the center.
legend_cell_align = "left", extra_kwargs = :subplot, but note that it seems each command should add such options.
two yaxis
plot(rand(10),
    # if necessary, set the margin since
    # I came across that part of the right label on the axis are invisible
    #margin=20Plots.mm
    )
plot!(twinx(),100rand(10))
refer to julia - Multiple Axis with Plots.jl - Stack Overflow