R Notes
Frequent Tips
- 删除当前工作区所有变量:
rm(list = ls(all = TRUE)) - RStudio shows all shortcuts:
Alt-Shift-K. - usage of
<<-, “it will keep going through the environments in order until it finds a variable with that name, and it will assign it to that.” see also
- 序列中
0.1+1:10-1中:优先级低于加减运算符,所以返回0.1, 1.1, ..., 9.1. - repeat string:
strrep('str', 2),paste(rep('str', 2), collapse='') - return the string of the input:
deparse(substitute(x)
seq_along(x) instead of 1:length(x)
vec <- c()
for (i in 1:length(vec)) print(vec[i])
would print two NULL because 1:length(vec) would be c(1,0). A method to avoid this
for (i in seq_along(vec)) print(vec[i])
save only accepts the names of objects
As the help manual said,
The … arguments only give the names of the objects to be saved: they are searched for in the environment given by the envir argument, and the actual objects given as arguments need not be those found.
> save(runif(10), file = "/tmp/test.txt")
Error in save(runif(10), file = "/tmp/test.txt") :
object ‘runif(10)’ not found
> x=runif(10)
> save(x, file = "/tmp/test.txt")
write lines to file
fileConn<-file("output.txt")
writeLines(c("Hello","World"), fileConn)
close(fileConn)
refer to Write lines of text to a file in R
I(X^2) vs X^2
注意
lm(Y ~ X + X^2)
和
lm(Y ~ X + I(X^2))
是不一样的。若要表示多项式回归,则应该用 I(X^2),而前者等价于 lm(Y ~ X),因为 X^2 表示 main effect and the second order interaction of X, and the interaction itself is none.
> model.frame(y ~ x +x^2,data = data.frame(x=rnorm(5), y=rnorm(5)))
           y          x
1  1.9991878 -1.0620178
2 -0.2629550  0.1464275
3 -1.2980284 -1.2884549
4 -0.4095742  1.8591457
5 -0.4168115 -1.1583192
> model.frame(y ~ x +I(x^2),data = data.frame(x=rnorm(5), y=rnorm(5)))
            y           x       I(x^2)
1 -1.47255329  0.01128263 0.000127....
2 -1.58704640 -1.21269206 1.470622....
3 -0.51949927 -0.33853804 0.114608....
4 -0.87250100 -1.71454770 2.939673....
5  0.07728536 -0.77660634 0.603117....
详见 ?formula, 其中举了一个例子,(a+b+c)^2 - a:b 等价于 a + b + c + a:c + b:c,注意二阶项只存在于交叉项中。
see also:
Error: unexpected ‘else’ in “else”
When evaluating in the REPL, else should not be on the next line.
> x <- 1
> if (x == 0) {
+   print(1)
+ }
> else print(2)
Error: unexpected 'else' in "else"
> x <- 1
> if (x == 0) {
+   print(1)
+ } else print(2)
[1] 2
invalid argument to unary operator: drop columns by name
> df = data.frame(x=runif(3), y=rnorm(3), z=rnorm(3))
> df[,-1]
        y          z
1 -1.093060  0.3862924
2 -1.169464  0.8150087
3 -1.983340 -0.6602526
> df[,-c("x")]
Error in -c("x") : invalid argument to unary operator

> df[, -which(colnames(df) %in% c("x"))]
        y          z
1 -1.093060  0.3862924
2 -1.169464  0.8150087
3 -1.983340 -0.6602526
data.table::rbind vs base::rbind
Note that base::rbind does not align according to the column names. data.table::rbind(, use.names = T) wouuld combine according to the column names. See also:
1 == “1” is TRUE
it seems dangerous.
all(NULL) is TRUE
> all(NULL)
[1] TRUE
> all(1==NULL)
[1] TRUE
> 1==NULL
logical(0)
escape needs too backslash
> grepl("x\\(y\\)", "x(y)z")
[1] TRUE
> grepl("x(y)", "x(y)z")
[1] FALSE
> grepl("x(y)", "xyz")
[1] TRUE
> grepl("x(y)", "x(y)z")
[1] FALSE
> grepl("x\(y\)", "x(y)z")
Error: '\(' is an unrecognized escape in character string starting ""x\("
gather: attributes should be identical across measure variables
want to combine the column pred.re and pred.tv into a new column pred and annote the source of values (.re or .tv) in the column method.
> str(df)
'data.frame':   28 obs. of  5 variables:
 $ pred.re: num [1:28, 1] -0.508 -0.359 -1.079 0.935 0.894 ...
  ..- attr(*, "scaled:center")= num -0.12
  ..- attr(*, "scaled:scale")= num 1.11
 $ pred.tv: num [1:28, 1] -0.129 -1.285 -1.76 -0.794 0.723 ...
  ..- attr(*, "scaled:center")= num -1.13
  ..- attr(*, "scaled:scale")= num 2.82
 $ truth  : num  35.2 36.3 37.9 37.3 21.1 ...
 $ status : Factor w/ 2 levels "0","1": 1 1 1 1 2 2 2 1 2 2 ...
 $ id     : int  1 2 3 4 5 6 7 8 9 10 ...
> dfa = gather(df, "method", "pred", -c(3:5))
Warning message:
attributes are not identical across measure variables;
they will be dropped
> str(dfa)
'data.frame':   56 obs. of  5 variables:
 $ truth : num  35.2 36.3 37.9 37.3 21.1 ...
 $ status: Factor w/ 2 levels "0","1": 1 1 1 1 2 2 2 1 2 2 ...
 $ id    : int  1 2 3 4 5 6 7 8 9 10 ...
 $ method: chr  "pred.re" "pred.re" "pred.re" "pred.re" ...
 $ pred  : num  -0.508 -0.359 -1.079 0.935 0.894 ...
Installation
Install from source on Rocky
Following the instruction in RStudio Documentation: Install R from Source
export R_VERSION=X.X.X
curl -O https://cran.rstudio.com/src/base/R-4/R-${R_VERSION}.tar.gz
tar -xzvf R-${R_VERSION}.tar.gz
cd R-${R_VERSION}
Build with
./configure \
    --prefix=/opt/R/${R_VERSION} \
    --enable-memory-profiling \
    --enable-R-shlib \
    --with-blas \
    --with-lapack

make
sudo make install
then manage the version with module.
2022-08-24 10:32:20
On T460P, change the prefix as follows
./configure \
    --prefix=/home/weiya/Programs/R/${R_VERSION} \
    --enable-memory-profiling \
    --enable-R-shlib \
    --with-blas \
    --with-lapack
specify CRAN mirror in install.package
r <- getOption("repos")
r["CRAN"] <- "https://cran.r-project.org"
# r["CRAN"] <- "r["CRAN"] <- "https://mirrors.ustc.edu.cn/CRAN/"" ## for mainland China
options(repos=r)
we also can wrap it with local({...}) and save in ~/.Rprofile. The benefit of local is to let the evaluation only valid in the current session. Note that RStudio would set r["CARN"] as https://cran.rstudio.com.
Refer to How to select a CRAN mirror in R
For temporary use, use repos argument in install.packages, such as
install.packages('RMySQL', repos='http://cran.us.r-project.org')
refer to How to select a CRAN mirror in R
installation of module
Follow the official instruction
curl -LJO https://github.com/cea-hpc/modules/releases/download/v5.1.1/modules-5.1.1.tar.gz
tar xvf modules-5.1.1.tar.gz
cd modules-5.1.1/
sudo apt-get install tcl-dev
make
# sudo make install
make install
Different from other software, module load command cannot be found, we need to configure as follows,
$ sudo ln -s $PWD/init/profile.sh /etc/profile.d/modules.sh
$ sudo ln -s $PWD/init/profile.csh /etc/profile.d/modules.csh
So the above make install indeed does not need sudo. Strangely, it still cannot find module, (require reboot?), so simply put source /etc/profile.d/modules.sh into ~/.bashrc
Install 4.1.0 from source
it throws when ./configure,
configure: error: libcurl >= 7.28.0 library and headers are required with support for https
try to install libcurl4-openssl-dev, suggested in Installing R on Linux: configure: error: libcurl >= 7.28.0 library and headers are required with support for https.
Be careful when installing the package, and to avoid the uninstallation in the next section.
2022-08-24 10:35:01
Run sudo apt-get install libcurl4-openssl-dev, and monitor the message, no packages are needed to be removed.
Installation of RCurl (2023-01-08 18:20:05)
First of all, it runs
curl-config --libs
curl-config --cflags
CURL_LIBS and CURL_CFLAGS. Check the configure.in file in the source of RCurl for more details.
-
With system’s
libcurl.so.4, shipped with system or installed vialibcurl4-openssl-dev, it outputswhere it does not specify the path to the dynamic files$ curl-config --cflags $ curl-config --libs -lcurl.sowith-Land to the header file with-I. -
On the other hand, for R env installed via
Conda, it returns,where the path are specified. And those path would become(R4.1.0) $ curl-config --cflags -I/media/weiya/PSSD/Programs/anaconda3/envs/R4.1.0/include (R4.1.0) $ curl-config --libs -L/media/weiya/PSSD/Programs/anaconda3/envs/R4.1.0/lib -lcurlrpathif we installed packages, such asRCurlthat relied on the dynamic files.where regardless of env$ readelf -d /media/weiya/PSSD/Programs/anaconda3/envs/R4.1.0/lib/R/library/RCurl/libs/RCurl.so Dynamic section at offset 0xb9a0 contains 23 entries: Tag Type Name/Value 0x0000000000000001 (NEEDED) Shared library: [libcurl.so.4] 0x0000000000000001 (NEEDED) Shared library: [libR.so] 0x0000000000000001 (NEEDED) Shared library: [libc.so.6] 0x000000000000000f (RPATH) Library rpath: [/media/weiya/PSSD/Programs/anaconda3/envs/R4.1.0/lib] (R4.1.0) $ ldd /media/weiya/PSSD/Programs/anaconda3/envs/R4.1.0/lib/R/library/RCurl/libs/RCurl.so linux-vdso.so.1 (0x00007ffca69ce000) libcurl.so.4 => /media/weiya/PSSD/Programs/anaconda3/envs/R4.1.0/lib/libcurl.so.4 (0x00007f9e67d77000) ... $ ldd /media/weiya/PSSD/Programs/anaconda3/envs/R4.1.0/lib/R/library/RCurl/libs/RCurl.so linux-vdso.so.1 (0x00007ffd18922000) libcurl.so.4 => /media/weiya/PSSD/Programs/anaconda3/envs/R4.1.0/lib/libcurl.so.4 (0x00007f6ac6fe4000)R4.1.0,libcurl.so.4would always point to the one used in the compilation step. In contrast, the system would depends on the environment sincecondawould changeLD_LIBRARY_PATH, whilerpathhas a higher priority thanLD_LIBRARY_PATH
set rpath via MAKEFLAGS (2023-01-08 20:44:08)
We can pass MAKEFLAGS, particularly LDFLAGS to set the rpath.
$ MAKEFLAGS='LDFLAGS=-Wl,-rpath=/lib/x86_64-linux-gnu/' R CMD INSTALL RCurl_1.98-1.9.tar.gz
$ readelf -d /opt/R/4.2.1/lib/R/library/RCurl/libs/RCurl.so

Dynamic section at offset 0xcd40 contains 27 entries:
Tag        Type                         Name/Value
0x0000000000000001 (NEEDED)             Shared library: [libcurl.so.4]
0x0000000000000001 (NEEDED)             Shared library: [libR.so]
0x0000000000000001 (NEEDED)             Shared library: [libc.so.6]
0x000000000000001d (RUNPATH)            Library runpath: [/lib/x86_64-linux-gnu/]
rpath is automatically changed to runpath. To force rpath, we can pass --disable-new-dtags option,
$ MAKEFLAGS='LDFLAGS=-Wl,--disable-new-dtags,-rpath=/lib/x86_64-linux-gnu/' R CMD INSTALL RCurl_1.98-1.9.tar.gz
$ readelf -d /opt/R/4.2.1/lib/R/library/RCurl/libs/RCurl.so

Dynamic section at offset 0xcd40 contains 27 entries:
Tag        Type                         Name/Value
0x0000000000000001 (NEEDED)             Shared library: [libcurl.so.4]
0x0000000000000001 (NEEDED)             Shared library: [libR.so]
0x0000000000000001 (NEEDED)             Shared library: [libc.so.6]
0x000000000000000f (RPATH)              Library rpath: [/lib/x86_64-linux-gnu/]
On the other hand, rpath can be further changed after compilation via patchelf,
/opt/R/4.2.1/lib/R/library/RCurl/libs$ readelf -d RCurl.so

Dynamic section at offset 0xcd60 contains 26 entries:
Tag        Type                         Name/Value
0x0000000000000001 (NEEDED)             Shared library: [libcurl.so.4]
0x0000000000000001 (NEEDED)             Shared library: [libR.so]
0x0000000000000001 (NEEDED)             Shared library: [libc.so.6]

/opt/R/4.2.1/lib/R/library/RCurl/libs$ patchelf --force-rpath --set-rpath "/lib/x86_64-linux-gnu/libcurl.so.4" RCurl.so
/opt/R/4.2.1/lib/R/library/RCurl/libs# readelf -d RCurl.so

Dynamic section at offset 0x3b000 contains 27 entries:
Tag        Type                         Name/Value
0x000000000000000f (RPATH)              Library rpath: [/lib/x86_64-linux-gnu/libcurl.so.4]
0x0000000000000001 (NEEDED)             Shared library: [libcurl.so.4]
0x0000000000000001 (NEEDED)             Shared library: [libR.so]
0x0000000000000001 (NEEDED)             Shared library: [libc.so.6]
See the private for more details.
–no-test-load (2023-01-08 22:10:59)
After replacing the default curl-config with mycurl-config, which specifies another path (such as Julia 1.8’s lib path) to libcurl.so.4, we can avoid the conflicts of libcurl.so
CURL_CONFIG=mycurl-config R CMD INSTALL RCurl_1.98-1.9.tar.gz
gcc -shared -L/opt/R/4.2.1/lib/R/lib -L/usr/local/lib -o RCurl.so base64.o curl.o curlInit.o curl_base64.o enums.o json.o memoryManagement.o myUTF8.o -L/opt/hostedtoolcache/julia/1.8.4/x64/bin/../lib/julia/ -lcurl -lxml2 -L/opt/R/4.2.1/lib/R/lib -lR
installing to /opt/R/4.2.1/lib/R/library/00LOCK-RCurl/00new/RCurl/libs
** R
** data
** inst
** byte-compile and prepare package for lazy loading
** help
*** installing help indices
** building package indices
** testing if installed package can be loaded from temporary location
Error: package or namespace load failed for ‘RCurl’ in dyn.load(file, DLLpath = DLLpath, ...):
unable to load shared object '/opt/R/4.2.1/lib/R/library/00LOCK-RCurl/00new/RCurl/libs/RCurl.so':
/usr/lib/x86_64-linux-gnu/libcurl.so.4: version `CURL_4' not found (required by /opt/R/4.2.1/lib/R/library/00LOCK-RCurl/00new/RCurl/libs/RCurl.so)
Error: loading failed
Execution halted
ERROR: loading failed
LD_LIBRARY_PATH and .Renviron, both of which attempt to use Julia’s libcurl.so.4, but failed.
Recall that the build step should have succeed, so we just need to skip the test step. It can be done via the option --no-test-load,
CURL_CONFIG=mycurl-config R CMD INSTALL --no-test-load RCurl_1.98-1.9.tar.gz
install.packages("RCurl", configure.args = c(RCurl = c("CURL_CONFIG=/usr/bin/mycurl-config", "--no-test-load")))
--no-test-load actually does not belongs to configure.args. If we just mv CURL_CONFIG to the env field (a recommended way in GitHub Actions),
# NOT WORK
> install.packages("RCurl", configure.args = c(RCurl = "--no-test-load"))
configure: error: unrecognized option: `--no-test-load'
Try `./configure --help' for more information
ERROR: configuration failed for package ‘RCurl’
INSTALL_opts, so the following will work.
install.packages("RCurl", INSTALL_opts = "--no-test-load")
MAKEFLAGS
Flags that are already set (for example in file etcR_ARCH/Makeconf) can be overridden by the environment variable MAKEFLAGS ()
Although CURL_LIBS cannot be directly overridden, it can pass via MAKEFLAGS
But a trick is that space needs to be escape. See also ,
Install Latest R3.6
Accidentally, I uninstall my R3.6 when installing libcurl4, the apt-log shows that
Start-Date: 2021-05-01  10:40:15
Commandline: apt install libcurl4
Requested-By: weiya (1000)
Install: libcurl4:amd64 (7.58.0-2ubuntu3.13)
Remove: r-cran-foreign:amd64 (0.8.75-1xenial0), r-cran-mgcv:amd64 (1.8-31-1cran1xenial0), libcurl3:amd64 (7.58.0-2ubuntu2), r-base-html:amd64 (3.6.3-1xenial), r-cran-class:amd64 (7.3-16-1xenial0), r-cran-boot:amd64 (1.3-23-2xenial0), r-cran-cluster:amd64 (2.1.0-2xenial0), r-cran-rpart:amd64 (4.1-15-2xenial0), r-cran-kernsmooth:amd64 (2.23-16-1+1xenial0), r-cran-matrix:amd64 (1.2-18-1xenial0), r-cran-spatial:amd64 (7.3-11-2xenial0), r-base-core:amd64 (3.6.3-1xenial), r-cran-codetools:amd64 (0.2-16-1xenial0), r-base:amd64 (3.6.3-1xenial), r-recommended:amd64 (3.6.3-1xenial), r-cran-nlme:amd64 (3.1.144-1xenial0), r-cran-lattice:amd64 (0.20-41-1cran1xenial0), r-cran-nnet:amd64 (7.3-13-1xenial0), r-cran-mass:amd64 (7.3-51.5-1xenial0), r-cran-survival:amd64 (3.1-11-1cran1xenial0)
End-Date: 2021-05-01  10:40:29
So I need to reinstall it. Following the instruction on CRAN
- add
deb https://cloud.r-project.org/bin/linux/ubuntu bionic-cran35/to/etc/apt/sources.list, actually I found a xenial version, which means that I had followed the procedure on Ubuntu 16.04. Currently I am on Ubuntu 18.04, so I use a bionic version. - run
sudo apt-get update, but it throws an error,
W: GPG error: https://cloud.r-project.org/bin/linux/ubuntu bionic-cran35/ InRelease: The following signatures were invalid: EXPKEYSIG 51716619E084DAB9 Michael Rutter marutter@gmail.com E: The repository ‘https://cloud.r-project.org/bin/linux/ubuntu bionic-cran35/ InRelease’ is not signed. N: Updating from such a repository can’t be done securely, and is therefore disabled by default. N: See apt-secure(8) manpage for repository creation and user configuration details.
The error has been reported in Linux#GPG error, and the solution is
sudo apt-key adv --keyserver keyserver.ubuntu.com --recv-keys 51716619E084DAB9
- run
sudo apt-get install r-base.
Multiple Versions
prefix + module (optionally)
specify --prefix when ./configure, e.g. Installing multiple versions of R on Linux – RStudio Support
Conda
Using R language with Anaconda
单独安装 rstudio(waste memory!!)conda install -c r rstudio- 共用 Rstudio,但是切换环境时找不到 shared library,而原生 R session 完全没问题。目前解决方案,命令行调用 rstudio 之前添加环境变量
conda activate R4.1.0
export LD_LIBRARY_PATH=/media/weiya/PSSD/Programs/anaconda3/envs/R4.1.0/lib:$LD_LIBRARY_PATH
rstudio
详见 Issue #32 use rstudio in env R4.1.0
Scripts
check memory usage
the unit is MB
memuse = function () {
    strtoi(system(paste("ps -p", Sys.getpid(), "-o rss="), intern = T)) / 1024
}
Rstudio
Failed to create OpenGL context
Info
- 2022-11-17 23:33:18 -0500: again, just reboot the PC.
Refer to rstudio #27 for the raw records.
It throws
WebEngineContext used before QtWebEngine::initialize() or OpenGL context creation failed.
Failed to create OpenGL context for format QSurfaceFormat(version 2.0, options QFlags<QSurfaceFormat::FormatOption>(), depthBufferSize 24, redBufferSize -1, greenBufferSize -1, blueBufferSize -1, alphaBufferSize -1, stencilBufferSize 8, samples 0, swapBehavior QSurfaceFormat::DefaultSwapBehavior, swapInterval 1, colorSpace QSurfaceFormat::DefaultColorSpace, profile  QSurfaceFormat::NoProfile)
Aborted (core dumped)
when launching without any special actions. Same error after replacing with an older version.
Laterly, note that nvidia card does not work, and change to another driver. Then it resumes after rebooting.
fcitx 时不能切换中文输入
曾经按照上述的指导能够解决这个问题,即将系统的 qt5 的 libfcitxplatforminputcontextplugin.so 手动添加到 rstudio 安装目录下的 plugins 中,即
sudo ln -s /usr/lib/$(dpkg-architecture -qDEB_BUILD_MULTIARCH)/qt5/plugins/platforminputcontexts/libfcitxplatforminputcontextplugin.so /usr/lib/rstudio/bin/plugins/platforminputcontexts/
但是后来又失败了,猜测原因可能是 qt5 的版本不再兼容了。在 Rstudio 顶部的菜单栏中,点击 Help > About Rstudio 可以找到具体的 qt 版本信息,比如 RStudio (Version 1.2.5001) 依赖 QtWebEngine/5.12.1,而系统的 Qt 插件版本没那么高,所以也能理解 libfcitxplatforminputcontextplugin.so 为什么不再有用了。一种解决方案便是手动重新编译与 Rstudio 中匹配的 Qt 插件的版本,但是似乎比较繁琐,而且也不能一劳永逸,如果 rstudio 更新,还是会失效。
索性不折腾了。如果真的需要中文,就用其他编辑器吧。期待 rstudio 官方早日解决这个问题……
Info
使用 ibus + rime 输入法后,就没再回去用 fcitx
更新 rstudio-1.0.44 后闪退 (outdated)
gdebi不再必须,(2022-11-17)更新至 rstudio-2022.07.2 直接采用dpkg -i即可。
安装 rstudio 应该采用
sudo apt-get install gdebi-core
wget https://download1.rstudio.org/rstudio-1.0.44-amd64.deb
sudo gdebi rstudio-1.0.44-amd64.deb
而非
sudo dpkg -i
另外,如果不行,删除后再装
sudo apt-get remove rstudio
plot.new() : figure margins too large
Rstudio 中对于太大的图片有可能报错,比如当我试图以 par(mfrow=c(4,1)) 画四个 matplot,于是报错。这时候,可以直接在 R session 里面绘制。或者,尝试清空历史图象。

incorrect number of dimensions (keep dims via drop)
> a = matrix(0, 2, 2)
> a[2,]
[1] 0 0
> a[2,][,1]
Error in a[2, ][, 1] : incorrect number of dimensions
> a[2,,drop=FALSE][,1]
[1] 0
sys.nframe()
Here is an equivalent way for pythonic if __name__ == "__main__"
# runs only when script is run by itself
if (sys.nframe() == 0){
# ... do main stuff
}
refer to
Example
sort(), rank(), order()
sort(x): sortxincreasingly (by default)rank(x): the ranks of each elementorder(x): the permutation forsort(x)
> x = c(97, 93, 85, 74, 32, 100, 99, 67)
> sort(x)
[1]  32  67  74  85  93  97  99 100
> order(x)
[1] 5 8 4 3 2 1 7 6
> rank(x)
[1] 6 5 4 3 1 8 7 2
and they satisfy (assuming no ties and in increasing order)
> x[order(x)]
[1]  32  67  74  85  93  97  99 100
> order(order(x))
[1] 6 5 4 3 1 8 7 2
In particular, if x = 1:n, then x = order(x) = sort(x), and hence
Python uses np.argsort to return the index of the sorted array, such as
>>> a = np.array([97, 93, 85, 74, 32, 100, 99, 67])
>>> sorted(a)
[32, 67, 74, 85, 93, 97, 99, 100]
>>> idx = np.argsort(a)
[32, 67, 74, 85, 93, 97, 99, 100]
>>> a[idx]
array([ 32,  67,  74,  85,  93,  97,  99, 100])
but keep in mind that the index starts from 0 instead of 1. Here is another way in Python | Returning index of a sorted list (TODO).
In julia, we use sort and sortperm.
data.table
DT[, 1+1] returns 2 instead of the second column
> DT = data.table(
ID = c("b","b","b","a","a","c"),
a = 1:6,
b = 7:12,
c = 13:18
)
> DT[, 1]
ID
1:  b
2:  b
3:  b
4:  a
5:  a
6:  c
> DT[, 2]
a
1: 1
2: 2
3: 3
4: 4
5: 5
6: 6
> DT[, 1+1]
[1] 2
> DT[, c(1+1)]
a
1: 1
2: 2
3: 3
4: 4
5: 5
6: 6
> DT[, `1+1`]
Error in `[.data.table`(DT, , `1+1`) :
j (the 2nd argument inside [...]) is a single symbol but column name '1+1' is not found. Perhaps you intended DT[, ..1+1]. This difference to data.frame is deliberate and explained in FAQ 1.1.
Matrix/Array
神奇的[
比如
A = array(sample(0:255, 100*100*3, replace = T), dim = c(100,100,3))
B = array(sample(1:100, 2*5), dim = c(2,5))
apply(A, 3, `[`, t(B))

     [,1] [,2] [,3]
[1,]  151   57  104
[2,]   52  221  151
[3,]  141  138  173
[4,]  164  212  108
[5,]   74  251  161
Row/Column of String Array cannot be changed to numeric
suppose I have a string array,
> a = array(dim=c(2,2))
> a
    [,1] [,2]
[1,]   NA   NA
[2,]   NA   NA
> a[1,1]="w"
> a[1, 2]= "1"
> a[2,1]="x"
> a[2,2]="2"
> a
    [,1] [,2]
[1,] "w"  "1"
[2,] "x"  "2"
> a[,2] = as.numeric(a[,2])
> a
    [,1] [,2]
[1,] "w"  "1"
[2,] "x"  "2"
> as.numeric(a[,2])
[1] 1 2
on the other hand, suppose we have a numeric array, set one row to be string, then all elements would become string automatically.
> b = array(dim=c(2,2))
> b
    [,1] [,2]
[1,]   NA   NA
[2,]   NA   NA
> b[1,]=1
> b[2,]=1
> b
    [,1] [,2]
[1,]    1    1
[2,]    1    1
> b[1,] = "1"
> b
    [,1] [,2]
[1,] "1"  "1"
[2,] "1"  "1"
Run from Command Line
- run
R -q -e "1+1"in the command line - run
Rscript test.Rin the command line - put
#!/usr/bin/env Rscripton the first line oftest.Rand allow it executable viachmod +x test.R
To pass arguments, we can use
args = commandArgs(trailingOnly=TRUE)
to extract the arguments.
Test with the following scripts
args = commandArgs(trailingOnly=TRUE)
print(length(args))
cat(args)
args = commandArgs(trailingOnly=FALSE)
print(length(args))
cat(args)
the results are
$ Rscript test1.R xxx yyy
[1] 2
xxx yyy
$ Rscript test2.R xxx yyy
[1] 7
/usr/lib/R/bin/exec/R --slave --no-restore --file=test2.R --args xxx yyy
which shows that trailingOnly=TRUE is necessary and it only takes the arguments after --args.
Refer to Passing arguments to an R script from command lines | R-bloggers
See also: Running R in batch mode on Linux
Round numbers
I want to approximate a numerical value with 3 significant digits, but the trailing zeros are always be dropped, then I tried several methods.
First of all, define
p <- function(x) { cat(deparse(substitute(x)), "=", x, "\n") }
return the string of the input: deparse(substitute(x)
substitute(x): return the expression itself without evaluating itdeparse(substitute(x)): turn an R expression into a character string
for convenient and clear comparisons, which takes the advantage of R’s Lazy Evaluation.
x = 0.04898246 # want 0.0490
p(signif(x, digits=3))
p(prettyNum(x))
p(prettyNum(x, digits=3))
p(formatC(x, drop0trailing = F))
p(formatC(x, drop0trailing = T))
p(format(signif(x, digits=3), nsmall = 3))
p(format(signif(x, digits=3), nsmall = 4))
p(format(signif(x, digits=3), nsmall = 3 + floor(-log10(x))))
# signif(x, digits = 3) = 0.049
# prettyNum(x) = 0.04898246
# prettyNum(x, digits = 3) = 0.049
# formatC(x, drop0trailing = F) = 0.04898
# formatC(x, drop0trailing = T) = 0.04898
# format(signif(x, digits = 3), nsmall = 3) = 0.049
# format(signif(x, digits = 3), nsmall = 4) = 0.0490
# format(signif(x, digits = 3), nsmall = 3 + floor(-log10(x))) = 0.0490
where floor(-log10(x)) returns the number of zeros between the decimal symbol . and the first nonzero value (assume x < 1).
With scientific = TRUE option, nsmall would fail,
p(format(signif(x, digits=3), scientific = T, nsmall = 3 + floor(-log10(x))))
# format(signif(x, digits = 3), scientific = T, nsmall = 3 + floor(-log10(x))) = 4.9e-02
as the manual ?format said,
the minimum number of digits to the right of the decimal point in formatting real/complex numbers in non-scientific formats. Allowed values are 0 <= nsmall <= 20.
For a larger value, such as 37289.75, the scientific form might be necessary,
y = 37289.75
p(format(signif(y, digits=3), nsmall= max(0, 3 + floor(-log10(y))) ) )
p(format(signif(y, digits=3), scientific = T))
# format(signif(y, digits = 3), nsmall = max(0, 3 + floor(-log10(y)))) = 37300
# format(signif(y, digits = 3), scientific = T) = 3.73e+04
Finally, I found that sprintf("%.2e", x) would be helpful, and actually the approximation has been consider, instead of just truncating.
p(sprintf("%.2e, %.1e", x, y))
#sprintf("%.2e, %.1e", x, y) = 4.90e-02, 3.7e+04
Interpreting Residual and Null Deviance in GLM R
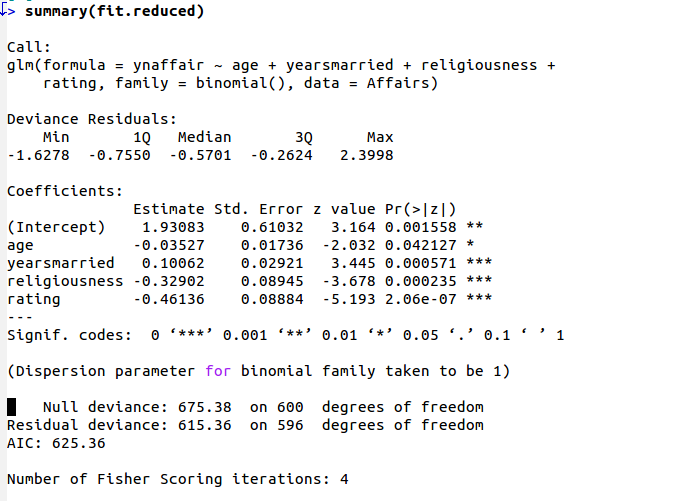
Refer to https://stats.stackexchange.com/questions/108995/interpreting-residual-and-null-deviance-in-glm-r
RSQLite
参考博文https://statr.me/2011/10/large-regression/
代码见sqlite_ex.R
Rcpp
Info
Another repo for learning Rcpp: RcppNotes
See also: - Reproducing R rep with the times argument in C++ and Rcpp
(Probably Outdated) cannot found -lRcpp
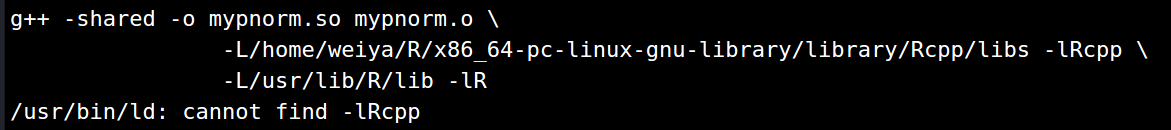
手动设置
cd /usr/local/lib
##cd /usr/lib
ln -s /home/weiya/R/x86_64-pc-linux-gnu-library/library/Rcpp/libs/Rcpp.so libRcpp.so
See also
function ‘dataptr’ not provided by package ‘Rcpp’
原因是因为没有在
dyn.load()
library(Rcpp)
## 或require(Rcpp)
manually add # Generated by roxygen2: do not edit by hand for NAMESPACE
If there is an error, “NAMESPACE file since it exists and not auto generated by roxygen2”, we can simply add # Generated ... manually, which will trigger roxygen2. See also:
rmarkdown
unwanted line break when keep_tex
Enabling keep_tex, I want to copy the tex file to overleaf, and then the grammar tools like Grammarly can be used to highlight the problematic grammar use. However, the copied tex would automatically add line breaks, and it hinders the proper use of Grammar tools due to line breaks.
The problem is caused by pandoc, and here is an option --wrap=none to disable the auto line break. By default, the option is auto. Check the pandoc manual for more details.
pdf: link and citation color
adding hyperref packages does not work. Tried
- add extra_dependencies
```
output: pdf_document: extra_dependencies: hyperref: [“unicode=true”, “breaklinks=true”, “colorlinks=true”, “linkcolor=blue”, “filecolor=magenta”, “urlcolor=cyan”]
- manually `\usepackage{hyperref}`

After enabling `keep_tex`, I found that later on there is an option `\hypersetup{hidelinks}`.

Finally, directly add option
``
    and there is no
hidelinks` option.
knit::kable
pretty table, which can auto newline long description in a cell. See also
overflow in pdf
Refer to . See also
output:
  pdf_document:
    pandoc_args: --listings
    includes:
      in_header: header.tex
header.tex includes
\lstset{
  language=R,
  breaklines=true,
  basicstyle=\ttfamily\footnotesize
}
unwanted space in pdf
There are unwanted spaces if we copy the text from pdf, or searching string like test_data, where there might be extra space like test _data or test _ data.
One solution is add columns=fullflexible () in the above \lstset, but the drawback is that the table format (such as summary.lm) would be destroyed.
On the other hand, we can use another font family \fontfamily{pcr}\selectfont (), then the solution is basicstyle=\ttfamily\footnotesize\fontfamily{pcr}\selectfont
Chinese Fonts in PDF
---
title: "test"
author: "weiya"
output:
    pdf_document:
        latex_engine: xelatex
        includes:
            in_header: header_zh.tex
---
where header_zh.tex is
\usepackage{xeCJK}
\setCJKmainfont{华文中宋}
\setmainfont{Times New Roman}
\usepackage{setspace}
\doublespacing
\setlength{\parindent}{2em}
\usepackage{bm}
\usepackage{float}
not show captions for two consecutive figures
add at least two spacing newline.
绘制 ROC 曲线时,必要时需要指定 label.ordering 中 negative 和 positive,否则结果会完全相反
ROCR 包的 prediction定义如下
prediction(predictions, labels, label.ordering = NULL)
在绘制ROC曲线时,必要时需要指定label.ordering中negative和positive,否则结果会完全相反。举个例子
## generate some data with a non-linar class boundary
set.seed(123)
x = matrix(rnorm(200*2), ncol = 2)
x[1:100, ] = x[1:100, ] + 2
x[101:150, ] = x[101:150, ] - 2
y = c(rep(1, 150), rep(2, 50))
dat = data.frame(x = x, y = as.factor(y))
plot(x, col = y)

## randomly split into training and testing groups
train = sample(200, 100)

## training data using radial kernel
svmfit = svm(y~., data = dat[train, ], kernel = "radial", cost = 1)
plot(svmfit, dat[train, ])

## cross-validation
set.seed(123)
tune.out = tune(svm, y~., data = dat[train, ], kernel = "radial",
                ranges = list(cost = c(0.1, 1, 10, 100, 1000),
                            gamma = c(0.5, 1, 2, 3, 4)))
summary(tune.out)

## prediction
table(true = dat[-train, "y"], pred = predict(tune.out$best.model, newdata = dat[-train, ]))

## ROC curves
library(ROCR)
rocplot = function ( pred , truth , ...) {
predob = prediction ( pred, truth , label.ordering = c("2", "1"))
perf = performance ( predob , "tpr" , "fpr")
plot ( perf,...)
}
svmfit.opt = svm(y~., data = dat[train, ], kernel = "radial",
                gamma = 3, cost = 10, decision.values = T)
fitted = attributes(predict(svmfit.opt, dat[train, ], decision.values = T))$decision.values

rocplot ( fitted , dat [ train ,"y"] , main ="Training Data")
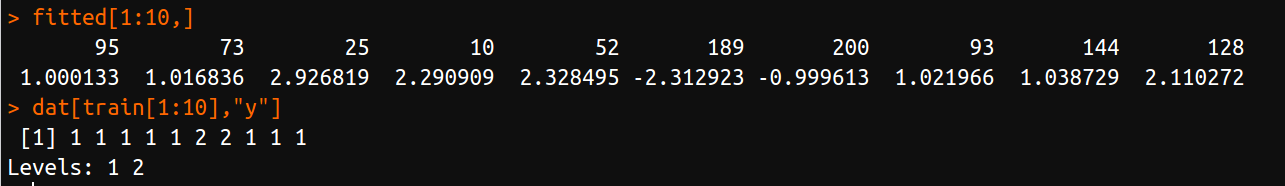
对于上述代码,如果不指定label.ordering = c("2", "1"),则得到的ROC曲线如下图
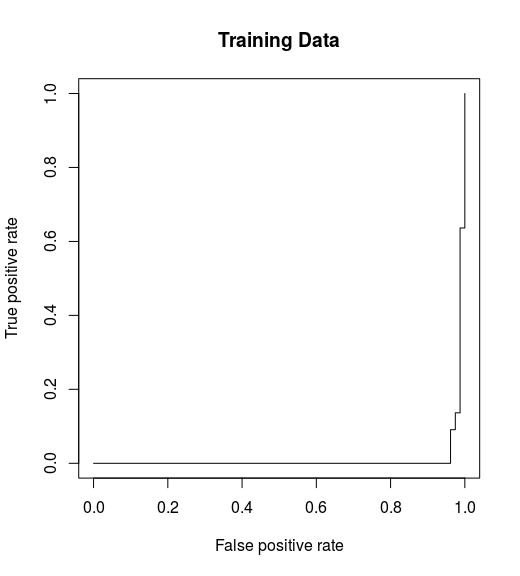
原因是因为fitted与y大小关系相反,即前者大时后者小,而前者小时后者大。
R 符号运算
参考 R 语言做符号计算。
NormDensity <- expression(1 / sqrt(2 * pi) * exp(-x^2 / 2))
D(NormDensity, "x")
DD <- function(expr, name, order = 1) {
 if (order < 1)
     stop("'order' must be >= 1")
 if (order == 1)
     D(expr, name) else DD(D(expr, name), name, order - 1)
 }
DD(NormDensity, "x", 3)

DFun <- deriv(NormDensity, "x", function.arg = TRUE)
DFun(1)
g++ error: possible incompatible version
error in install gRbase
environment: Ubuntu 16.04 (gcc 5.4.0)
g++: error: unrecognized command line option ‘-fno-plt’
the reason should be that the current gcc is too old.
In conda env R:
- install latest gcc v7.3.0, but it still does not work
Sys.getenv()indeed switch to the latest gcc- remove
~/.R/Makevars, which would force the gcc to be the gcc declared in that file. - then it works well.
refer to
CRAN vs BioConductor
Note that some packages cannot be installed via CRAN, and you can check bioconductor.
if (!requireNamespace("BiocManager", quietly = TRUE))
    install.packages("BiocManager")

BiocManager::install("graph")
protection stack overflow
use
R --max-ppsize 500000
or for rstudio
rstudio --max-ppsize 500000
refer to How to solve ‘protection stack overflow’ issue in R Studio
failed to create lock directory
In bash,
R CMD INSTALL --no-lock <pkg>
or in R session
install.packages("Rcpp", dependencies=TRUE, INSTALL_opts = c('--no-lock'))
refer to R install.packages returns “failed to create lock directory”
S3 method
初体验,ESL-CN/code/boosting/s3ex.R
j = list(name = "Joe", salary = 5500, union = T)
class(j) = "employee"

print.employee <- function(wrkr){
  cat(wrkr$name, "\n")
  cat("salary", wrkr$salary, "\n")
  cat("union member", wrkr$union, "\n")
}
summary.employee <- function(wrkr){
  cat(wrkr$name, "\n")
  cat("salary", wrkr$salary, "\n")
  cat("union member", wrkr$union, "\n")
}
以及一个相关的问题 How to override default S3 function in R?
Parallel Computing
related packages
parallel:makeClusterandstopClusterdoParallel:registerDoParallelforeach:%dopar%
calc_lda_BIC
adapt from my project
cl <- makeCluster(ncl)
registerDoParallel(cl)


res = foreach(j=1:Nnset, .combine = 'c', .export = c('calc_lda_BIC'), .packages = 'nnet') %dopar%
{
  jj = not_set[j];
  new_set   = sort(c(jj, cur_set));
  new_score = calc_lda_BIC(xx, yy, new_set, D, K, debug, gam=gam);
  new_score
}
stopCluster(cl)
library(..) might be necessary
For example,
Error in `checkForRemoteErrors()`:
! 3 nodes produced errors; first error: Error in coxph(surv.formula, x = TRUE, data = surv_data.train, model = TRUE) :
  could not find function "coxph"
Backtrace:
 1. ... %dopar% ...
 2. e$fun(obj, substitute(ex), parent.frame(), e$data)
 3. parallel::clusterApplyLB(cl, argsList, evalWrapper)
 4. parallel:::dynamicClusterApply(cl, fun, length(x), argfun)
 5. parallel:::checkForRemoteErrors(val)
library(JM) into the loop.
using R in JupyterLab
install.packages('IRkernel')
#IRkernel::installspec()
IRkernel::installspec(name="3.6.0", displayname = "R 3.6.0")
refer to IRkernel
and try to use jupyterlab, which seems much powerful than jupyter.
But note that -X option is needed before creating a tmux session for running jupyter, otherwise the kernel keeps dead in the browser and check the monitor message from jupyter, which throws,
Error in .External2(C_X11, paste0("png::", filename), g$width, g$height,  :
  unable to start device PNG
Calls: <Anonymous> ... evaluate -> dev.new -> do.call -> <Anonymous> -> ok_device
In addition: Warning message:
In ok_device(filename, ...) : unable to open connection to X11 display ''
Execution halted
although I am just trying to calculate 1+1, nothing related to X11.
The error would appear again if the -X ssh session has been stopped. Then I found such issue has been reported in https://github.com/IRkernel/IRkernel/issues/388, and there might be solution by https://github.com/IRkernel/IRkernel/issues/388#issuecomment-237080809, but the working R version is built from source by myself, and Cairo is not supported. When I am trying to install the package, it throws that
configure: error: Cannot find cairo.h! Please install cairo (http://www.cairographics.org/) and/or set CAIRO_CFLAGS/LIBS correspondingly.
ERROR: configuration failed for package ‘Cairo’
Even I retried after specifying
export CAIRO_LIBS=/home/project09/miniconda3/envs/r3.6.3/lib
export CAIRO_CFLAGS=/home/project09/miniconda3/envs/r3.6.3/include
by linking it to other R version with Cairo support, similar as in https://stat.ethz.ch/pipermail/r-help/2014-April/374096.html, but it does not work.
Then I change to a different R version with cairo support, and it can work without -X option. And the setting in .Rprofile can also been removed (or actually the default is exactly the same).
Try to install the shortcuts as recommended, but it throws,
$ jupyter labextension install @techrah/text-shortcuts
An error occured.
ValueError: Please install Node.js and npm before continuing installation. You may be able to install Node.js from your package manager, from conda, or directly from the Node.js website (https://nodejs.org).
See the log file for details:  /tmp/jupyterlab-debug-7mmu8jy1.log
then
conda install -c conda-forge nodejs
as suggested in Extensions
However the default version is outdated.
libgcc-7.2.0         | 304 KB    | ############################################################################################################################################# | 100%
nodejs-6.13.1        | 11.9 MB   | ############################################################################################################################################# | 100%
Preparing transaction: done
Verifying transaction: done
Executing transaction: done
(base) [project09@stapc390 ~]$ jupyter labextension install @techrah/text-shortcuts
An error occured.
ValueError: Please install nodejs >=10.0.0 before continuing. nodejs may be installed using conda or directly from the nodejs website.
See the log file for details:  /tmp/jupyterlab-debug-lhf6bjwm.log
The solution is quite easy, just use the default conda channel,
conda install nodejs
which will install nodejs-10.13.0.
reload data
> mtcars$transmission = factor(mtcars$am, levels = c(0, 1), labels = c("Automatic", "Manual"))
> str(mtcars)
'data.frame':   32 obs. of  12 variables:
...
 $ am          : num  1 1 1 0 0 0 0 0 0 0 ...
 $ gear        : num  4 4 4 3 3 3 3 4 4 4 ...
 $ carb        : num  4 4 1 1 2 1 4 2 2 4 ...
 $ transmission: Factor w/ 2 levels "Automatic","Manual": 2 2 2 1 1 1 1 1 1 1 ...
> data("mtcars")
> str(mtcars)
'data.frame':   32 obs. of  11 variables:
...
 $ am  : num  1 1 1 0 0 0 0 0 0 0 ...
 $ gear: num  4 4 4 3 3 3 3 4 4 4 ...
 $ carb: num  4 4 1 1 2 1 4 2 2 4 ...
Stats Functions
stats::ecdf: empirical cumulative distribution function
Update Library Path
Info
Post: 2022-08-30 12:00:39 +0800
The disk is nearly occupied, and I found that
$ du -sh *
2.6G    R
which stores the installed packages for R3.6. I want to move it to ~/Programs/R, which is on a portable SSD, so I need to update .libPaths().
The personal path is defined in /usr/lib/R/etc/Renviron
R_LIBS_USER=${R_LIBS_USER-'~/R/x86_64-pc-linux-gnu-library/3.6'}
Replace it with
R_LIBS_USER=${R_LIBS_USER-'~/Programs/R/x86_64-pc-linux-gnu-library/3.6'}
Tip
Start from R4.0.0, the path string can be constructed via r(...) without escaping /.
> r"(~/R/x86_64-pc-linux-gnu-library/3.6)"
[1] "~/R/x86_64-pc-linux-gnu-library/3.6"
See
Misc Links
- semi-transparency is not supported on this device
- Releasing a package
- Presentations with Slidy
- Estimation of the expected prediction error
- 协方差矩阵的几何解释